A digital fluid balance chart for your phone
Log your input and output, let the app total the net for the day, and keep a tidy record you can print — no more loose paper charts.
A fluid balance chart — the input/output chart you may have been handed on a clipboard or a printed sheet — is one of the most familiar records in fluid management. It lists everything that goes in and everything that comes out over a 24-hour day, and the difference between the two columns is your net balance. The idea is simple; the bookkeeping is the tedious part. Kidney Tracker keeps the same fluid balance chart on your iPhone and does the adding up for you.
Input and output, totalled for you
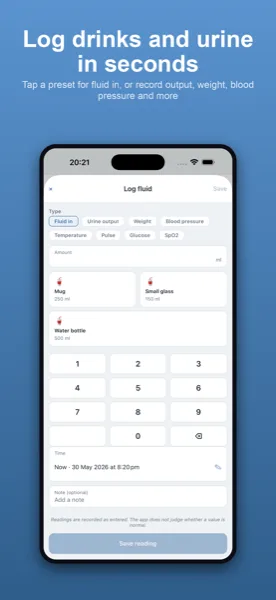
Logging an entry takes a couple of seconds: choose intake or output, enter the amount in millilitres, and it's recorded with a timestamp. Behind the scenes the app keeps a running total of both columns and works out the net for the day, so the figure a paper input/output chart asks you to calculate by hand is simply there on the Today screen. Saved drink sizes make the common entries a single tap, and Siri, the widget and the Apple Watch complication let you add an entry without even opening the app.
A configurable day to match a 24-hour chart
Paper fluid balance charts usually run on a fixed 24-hour cycle that may not begin at midnight. Kidney Tracker lets you set your own day-start hour, so the chart's window opens when you need it to. That means the daily total you read off the screen can line up exactly with the 24-hour period your chart is run over, rather than being split across two calendar days.
A printable chart instead of a paper one
The advantage of keeping the chart on your phone is that it is always with you and never gets lost or smudged. When you need a copy on paper, you can generate a clean, printable report of your input and output and print or share it. The report is produced on your device, the app keeps no copy, and it goes only where you choose to send it — so the digital chart can still become a physical one whenever that is useful.
More than one column
A fluid balance chart is often only part of what you are asked to keep an eye on. Alongside input and output, Kidney Tracker can record weight, blood pressure, medications with reminders, and blood results, each on its own chart. So the same app that replaces your paper input/output chart also gathers the other numbers into one private place, ready to review or print together.
Private, on your device
There is no account and no sign-up, and nothing is uploaded. Your fluid balance chart and everything else you log live in a database on your own iPhone, which means you are the only person who can see it until you decide to share a report.
Kidney Tracker is a personal record-keeping tool. It is not a medical device and does not provide medical advice — always follow your own clinical team.
FAQ
Common questions
Related ways to use Kidney Tracker
Swap the paper chart for your phone
Kidney Tracker is in beta and free to try. Join through TestFlight — no account needed.
Join the beta on TestFlightiPhone only for now · Free during beta